Port Coquitlam

CLICK ON THIS INTERACTIVE MAP! It’s loaded with helpful information. Explore Port Coquitlam Real Estate MLS Listings, see market statistics, search the MLS for all homes, condos and townhouses for sale in the city.

PORT COQUITLAM

Port Coquitlam is a residential city at the junction of the Fraser and Pitt Rivers.  When Port Coquitlam was first incorporated in 1913, it was mostly rural farmland. But as Metro Vancouver has grown those farms have been developed into tracts of suburban housing. Port Coquitlam is now one of the fastest growing cities in the Greater Vancouver area.


Sorry we are experiencing system issues. Please try again.

THINKING OF BUYING OR SELLING? CONTACT US TODAY:

"*" indicates required fields

Name*

PORT COQUITLAM NEIGHBOURHOODS


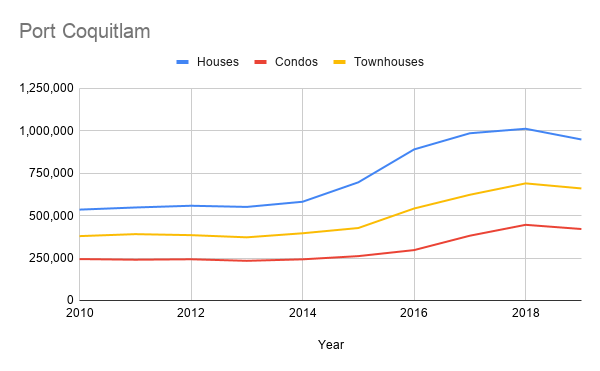
Port Coquitlam Real Estate MLS Listings Prices & Stats

Port Coquitlam Real Estate MLS Listings House Prices

YearAverageHighLowMedianAVG $/SFMedian $/SFBuilt After 2000Built Before 2000AVG DOMCount
2010535,4941,130,000278,000524,165244236621,983529,6353853
2011548,059890,000295,000541,958249244653,102539,3244058
2012558,2551,538,000270,000548,931255248651,394551,7663948
2013551,4271,040,000290,000540,758251247663,749537,6663954
2014581,8381,230,000310,000574,776262255614,011568,7902960
2015696,3411,650,000328,000674,365311296833,423679,4222075
2016890,1352,500,000370,000861,8884093911,067,712873,83814571
2017985,3792,000,000560,000942,0004484251,185,941949,78021471
20181,011,8761,700,000650,000998,0004674451,141,159998,43827308
2019948,7191,888,800530,000919,0004244141,189,677912,24039289

Port Coquitlam Real Estate MLS Listings Condo Prices

YearAverageHighLowMedianAVG $/SFHighLowAverage MedianBuilt After 2000Built Before 2000AVG DOMCount
2010244,184608,72477,000235,10027637213127865,74450,76647194
2011240,404495,000110,000239,843271387138271283,220206,67652204
2012242,989490,00094,000238,695279423123277269,795209,36462184
2013233,830738,00095,000235,313265418121266268,565195,64057177
2014242,619720,00090,000241,906271409114274263,673196,71354216
2015261,510616,00096,500257,347295453127299289,110183,89144305
2016296,999670,000105,000289,999346574117351331,740245,75020698
2017381,7971,038,000130,000379,000438758197436430,833323,33612585
2018445,938935,000230,000440,000519812294509486,196402,80516435
2019421,184935,000180,000415,000498895281491451,638381,41633392

Port Coquitlam Real Estate MLS Listings Townhouse Prices

YearAverageHighLowMedianAVG $/SFHighLowAverage MedianBuilt After 2000Built Before 2000AVG DOMCount
2010379,378720,000177,000371,204237307175232358,628363,1764553
2011390,988745,000177,000384,601232300173227395,696380,8394845
2012385,114610,000155,600390,870242314181240390,686387,9984150
2013372,270620,000209,900371,483250322177251383,944371,2284868
2014396,135620,000170,000391,158252314182256388,972377,8233380
2015427,088888,000153,000412,537272345191270442,871407,2792874
2016542,031810,000190,000540,000351502198344548,506536,78516315
2017622,973956,000301,000623,500411589227410642,579599,30114298
2018690,0361,025,000346,000680,659448611287446715,150661,33620210
2019660,2721,140,000295,000650,000420660217422672,362644,45437247